Ternary Diagram Generator
Blank ternary plot paper for three-component mixtures, with 0–100 % scales on every side and your own corner names.
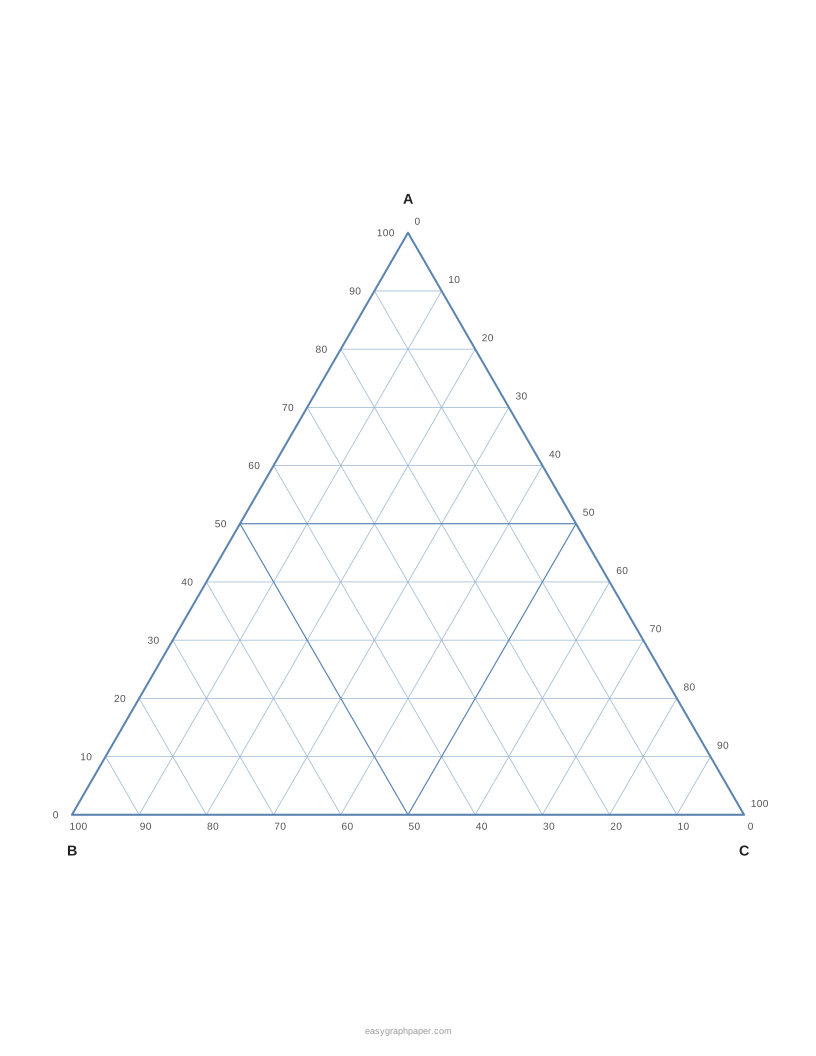
A ternary diagram is an equilateral triangle used to plot mixtures of three components whose shares add up to 100 %. This free ternary diagram generator draws the sheet in your web browser, so you can make a ternary plot or triangle plot to print or save, with no sign-up and no download.
Each corner stands for 100 % of one component, and the opposite side stands for 0 % of it. Grid lines run parallel to each side, which makes it easy to locate any blend of three ingredients, soil fractions or alloy elements. The shape is also called a Gibbs triangle. You can set the grid spacing, corner names and paper size, then print ternary graph paper or triangular graph paper for your work.
How to use the ternary diagram generator
- Choose a paper size (US Letter, A4, US Legal, Tabloid, A3 or A5) and portrait or landscape.
- Pick how many triangles to fit on the page: 1, 2 or 4.
- Choose the grid spacing: every 10 %, 5 %, 2 %, 1 %, 20 % or 25 %.
- Choose the heavier lines: automatic, or every 10, 20, 25 or 50 %.
- Type names for the three corners, or select the ‘Soil texture’ preset (Clay at the top, Sand bottom-left, Silt bottom-right).
- Pick a line colour (light blue, grey, black, green, red, purple or a custom colour) and a line weight (fine, normal or bold).
- Under ‘Page and print settings’, set the margin, an optional title, an optional Name and Date line, and the number of pages (1 to 50). You can also switch off the small site address in the bottom margin.
- Check the preview and the triangle size under it, then press Print, Download PDF, SVG or Copy link.
To print true-size triangles, choose 100 % or ‘Actual size’ in the print dialog and turn off ‘Fit to page’ or ‘Shrink to fit’, because fitting shrinks the drawing slightly. Copy link stores all current settings, so you can recreate the same sheet later or share it. The page also remembers the paper size you chose last time in your browser.
What is a ternary diagram?
A ternary diagram is an equilateral triangle that plots three components whose shares add up to 100 %. Each corner represents 100 % of one component, and the side opposite that corner represents 0 % of it. Every point inside the triangle is one mixture of the three.
This page uses a fixed layout. Component A is at the top corner, B is at the bottom left and C is at the bottom right. Each side carries a 0 to 100 scale for one component, running towards that component’s own corner. The centre of the triangle is one third of each component, or 33.3 % A, B and C.
The diagram appears under several names: ternary plot, triangle plot, ternary graph paper and Gibbs triangle. It is used in geology to classify rocks and minerals, in soil science for soil texture, in materials science and chemistry for ternary phase diagrams of three-element alloys and ceramics, and for mixing ratios of three ingredients.
How to read a ternary diagram
To read a point, find the value for each component by following the grid line through the point that runs parallel to the side opposite that component. Read the value where that line meets the component’s scale. The three values always add up to 100 %, so reading two of them is enough to check the third.
The method works the same way for every component:
- Pick a point inside the triangle.
- For A, follow the line through the point that runs parallel to the bottom side, and read its value on A’s scale.
- For B, follow the line parallel to the right side, and read its value on B’s scale.
- For C, follow the line parallel to the left side, and read its value on C’s scale.
- Check that the three numbers add up to 100 %.
Points near a corner contain mostly that corner’s component. Points on a side contain none of the component at the opposite corner. Points near the centre contain roughly equal shares of all three.
Examples made with this generator
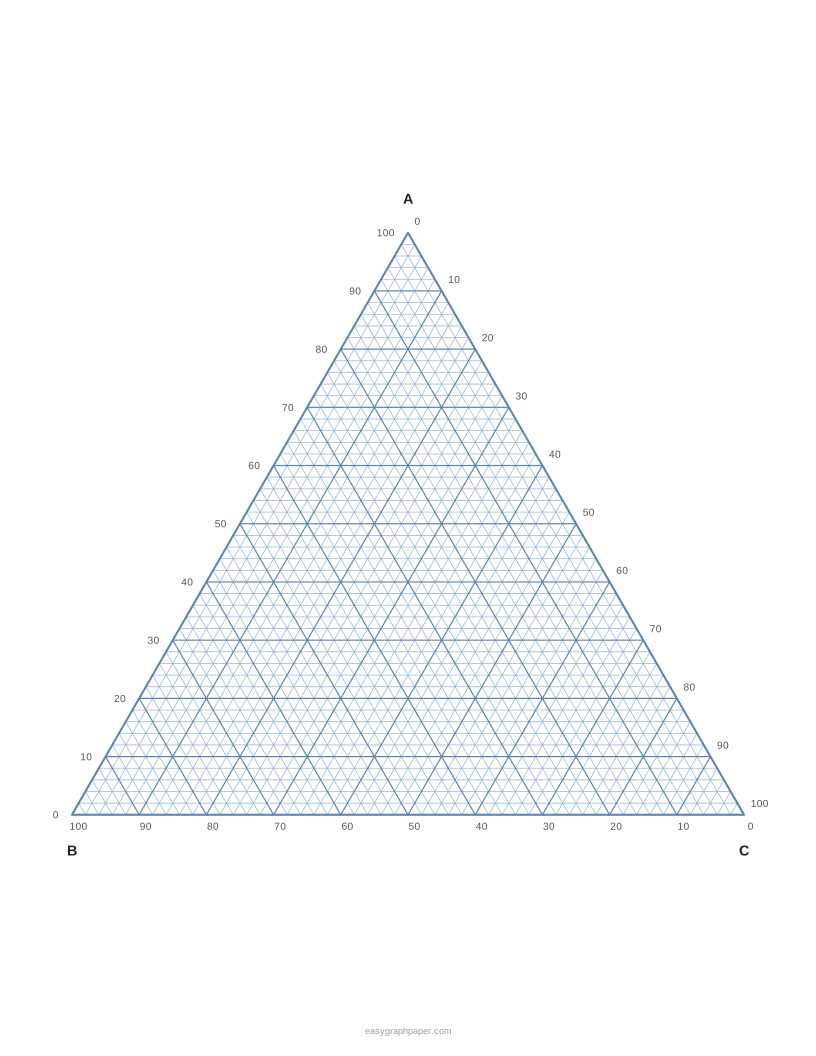
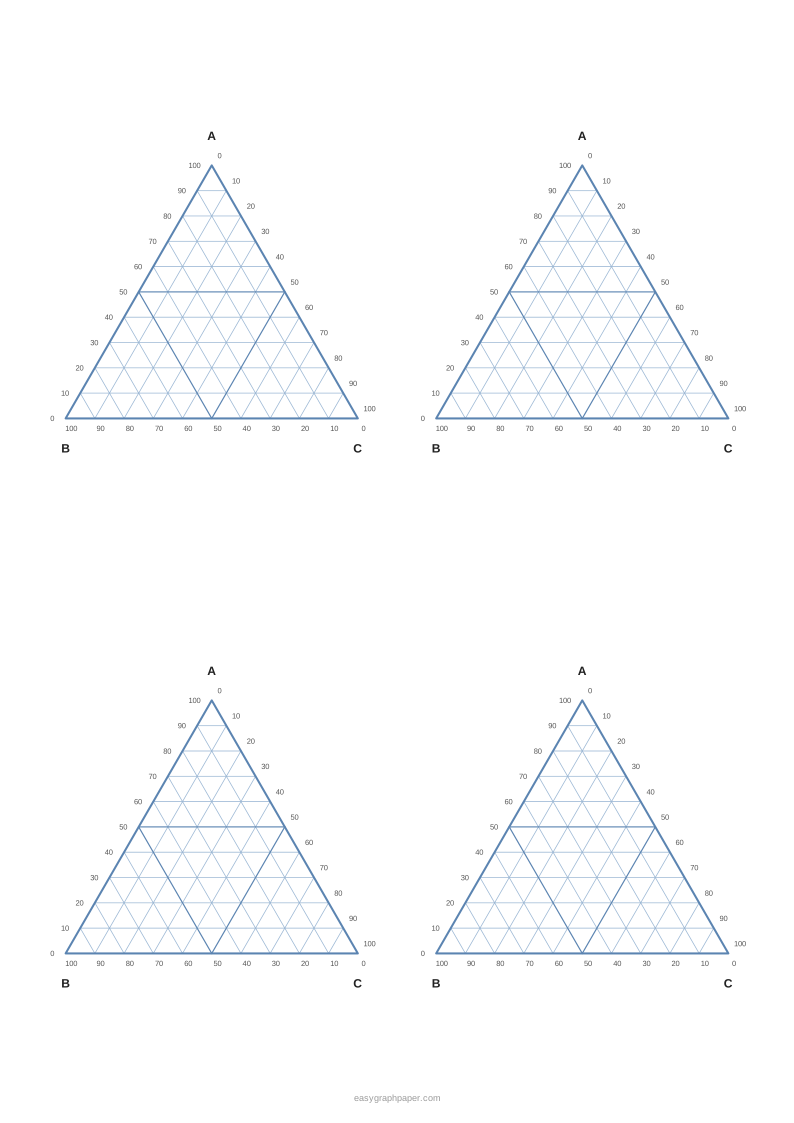
Frequently asked questions
What is a Gibbs triangle plot?
A Gibbs triangle plot is another name for a ternary diagram. It is named after the scientist Josiah Willard Gibbs, who used this triangle to show mixtures of three components. The plot is drawn the same way whichever name you use.
How to plot a ternary diagram?
Find the line for the first component at its value, parallel to the side opposite its corner. Do the same for the second component, and mark the point where the two lines cross. For 50 % A, 30 % B and 20 % C, the C line through that point should read 20 %.
How to read a ternary phase diagram?
Read a ternary phase diagram exactly as you would read any ternary diagram, using the grid lines parallel to each side. The regions or lines drawn on the diagram show which phases or states a mixture of those proportions forms. Check the labels on the corners to confirm which component each corner represents.
What does the centre of a ternary diagram mean?
The centre is the point where all three components have equal shares, which is 33.3 % each. Moving towards a corner increases that corner’s component, and moving towards a side reduces it.
How big is the triangle on US Letter paper?
With one triangle on US Letter, each side measures 177.8 mm. If you choose four triangles per page, each side measures 80.2 mm.
Is this ternary graph paper free to use?
Yes. The generator is free, needs no sign-up or download, and draws the sheet in your browser. Your settings are not uploaded.
Related paper templates
- Isometric graph paper: use it for drawing three-dimensional shapes on a triangular grid.
- Smith chart: use it for plotting impedance in electrical engineering.
- Polar graph paper: use it for plotting points by angle and distance from a centre.
- Log graph paper: use it when your data spans several orders of magnitude.
- Grid paper: use it for plain square grids in maths, drafting or layouts.
- Graph paper generator: use it to create other graph paper layouts.