Printable Smith Chart
A blank Smith chart for RF and transmission-line work, with outer scales and an optional admittance overlay.
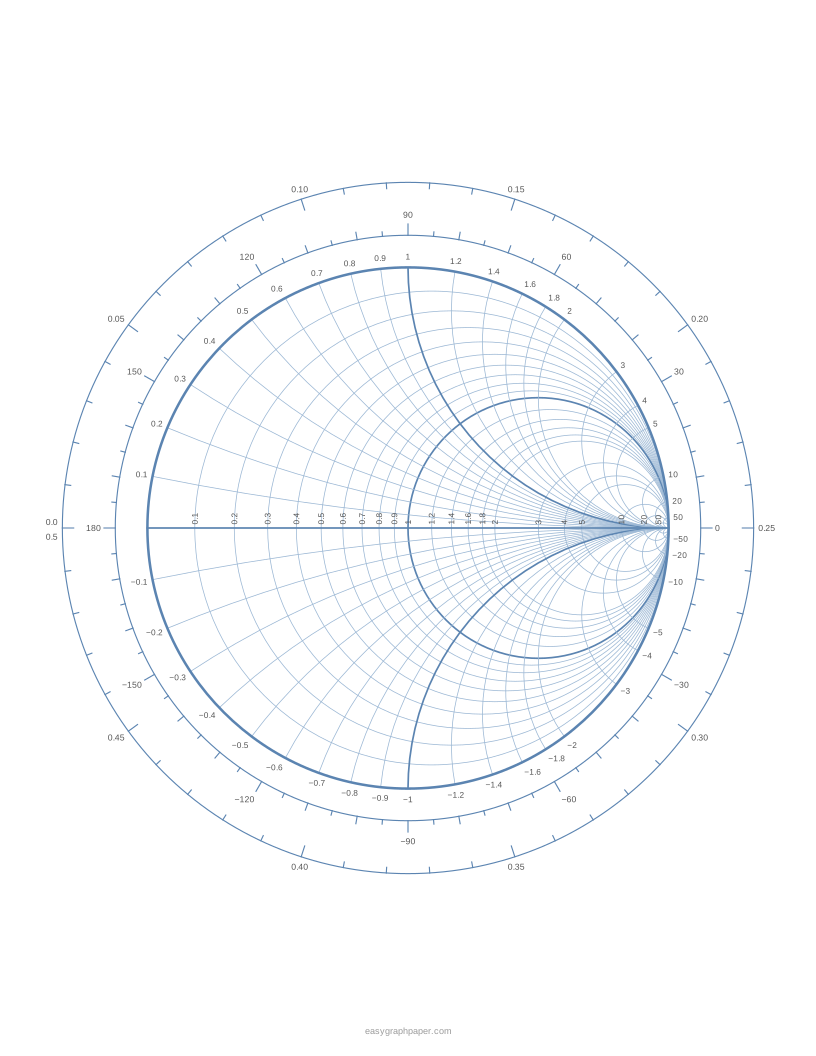
A Smith chart is a graphical tool for radio-frequency (RF) and transmission-line problems, and this page generates a printable one in your web browser. It is free, needs no sign-up and no download, so you set the options, check the preview, and print or save the sheet right away.
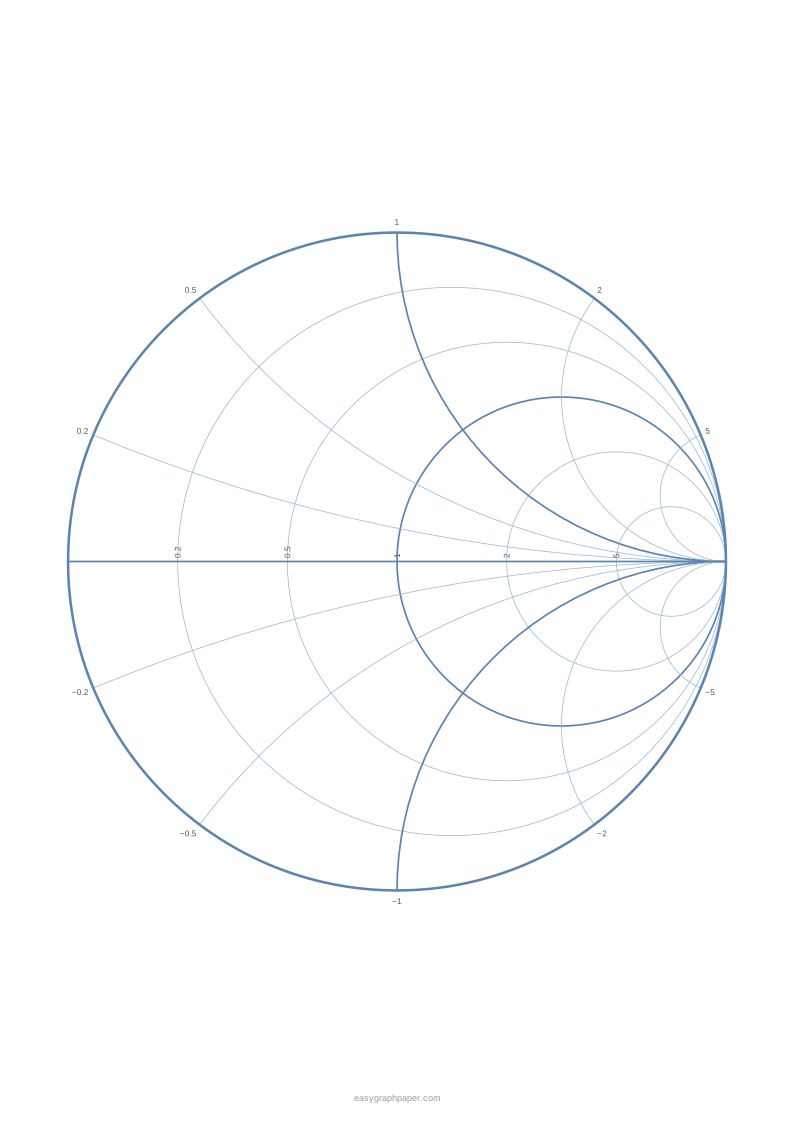
You can choose line density, labels, outer wavelength and angle scales, and an admittance overlay drawn in a second colour. Paper sizes include US Letter, A4, US Legal, Tabloid, A3 and A5, in portrait or landscape. The sheet is drawn as vector graphics, so the lines stay sharp when printed or downloaded as a PDF.
How to use the Smith chart tool
- Pick a paper size: US Letter, A4, US Legal, Tabloid, A3 or A5; A3 or Tabloid gives a bigger chart.
- Choose portrait or landscape.
- Set the line density: basic, standard (22 resistance and 21 reactance values) or fine (49 and 48).
- Turn labels on or off.
- Turn on the outer scales if you need them: wavelengths toward the generator from 0 to 0.5 λ in 0.01 λ ticks, and the reflection-coefficient angle in degrees.
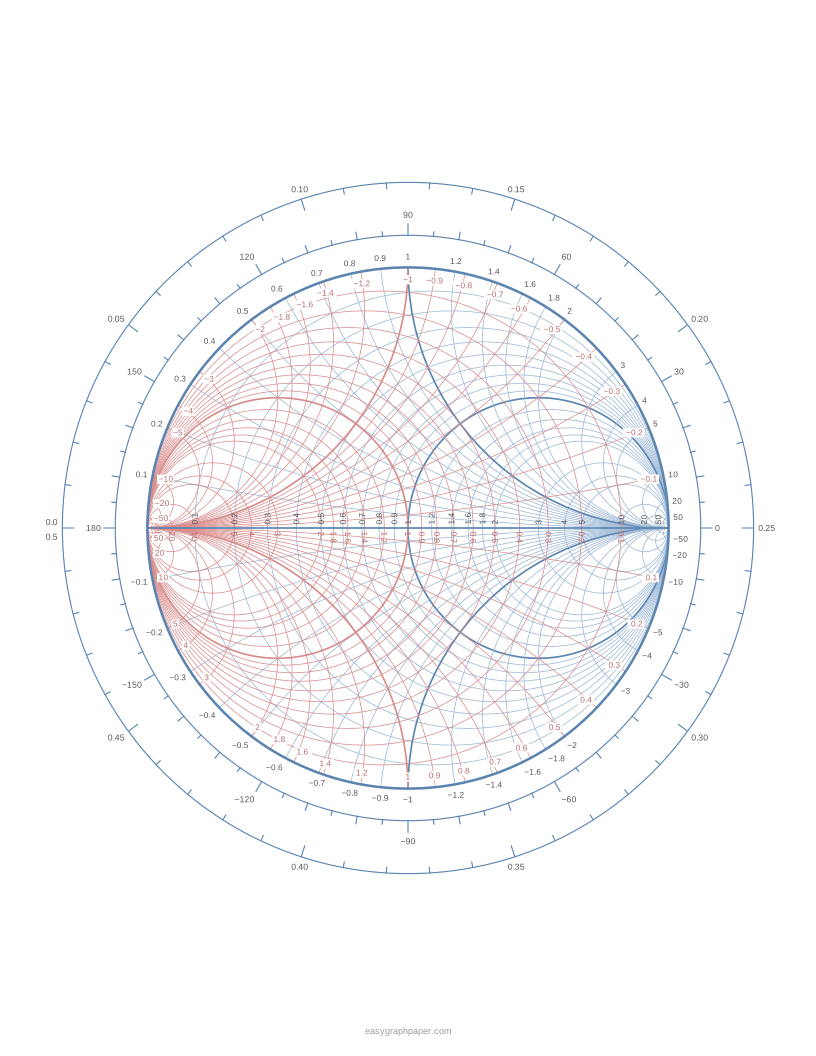
- Turn on the admittance overlay to draw the Y chart in a second colour on top of the impedance chart.
- Pick a line colour preset or a custom colour, and a line weight: fine, normal or bold.
- Under Page and print settings, set the margin, add an optional title or a Name and Date line, and choose the number of pages (1 to 50).
- Check the preview and the chart size under it, then press Print, Download PDF, SVG or Copy link.
With scales on US Letter, the chart is 137.9 mm across; without scales, it is 179.9 mm. Print at 100 % or “Actual size” and turn off “Fit to page” or “Shrink to fit” so the chart keeps that size. Copy link stores all current settings, so you can recreate or share the same sheet.
What is a Smith chart?
A Smith chart is a graphical tool for solving radio-frequency (RF) and transmission-line problems. Phillip H. Smith invented it and published it in 1939.
It plots normalised impedance z = Z / Z0, where Z0 is the characteristic impedance, often 50 ohms, on the plane of the reflection coefficient Γ = (z − 1) / (z + 1). The outer circle is |Γ| = 1.
What is a Smith chart used for?
It is used to see how an impedance changes as you move along a transmission line, and to design matching networks. Moving along a lossless line moves the point around a circle centred on the chart centre, and one full turn is half a wavelength (0.5 λ).
Three points matter most. The centre is a matched load (z = 1, no reflection). The left end of the horizontal axis is a short circuit (z = 0), and the right end is an open circuit (z = ∞).
How to read a Smith chart
To read a value, find the resistance circle through your point. The labels run along the horizontal axis. Then find the reactance arc through the same point, with labels around the edge.
Circles of constant resistance all touch the rightmost point of the chart. Arcs of constant reactance start from that point too. Positive (inductive) reactance lies in the upper half, and negative (capacitive) reactance lies in the lower half. For example, z = 1 + j1 is where the r = 1 circle meets the +x = 1 arc.
What is the complete Smith chart?
“The Complete Smith Chart” is the title printed on the classic Smith chart form. Besides the resistance circles and reactance arcs, that form surrounds the chart with outer scales (wavelengths toward the generator and toward the load, and the angle of the reflection coefficient) and adds rulers below it for quantities such as SWR and return loss.
This generator draws the chart with the wavelength and reflection-angle scales when “Outer scales” is on; it does not draw the rulers.
Is the Smith chart hard?
It looks crowded at first, but a small set of rules covers most uses. Resistance circles touch the right-hand point, reactance arcs start there, and the centre means a match. Moving toward the generator turns the point clockwise around the centre.
Practice with a few points, such as z = 1 + j1 or z = 2, and the chart becomes much easier to follow.
What is VSWR on a Smith chart?
VSWR, the voltage standing wave ratio, is shown by a circle centred on the chart centre. The radius of that circle is |Γ|, and VSWR = (1 + |Γ|) / (1 − |Γ|).
A circle through r = 2 on the right-hand axis is VSWR 2. The point z = 2 gives |Γ| = 1/3, so VSWR = (4/3) / (2/3) = 2.
Impedance and admittance Smith charts
An impedance Smith chart plots z. An admittance Smith chart uses the same set of circles, turned through 180°. A combined impedance-admittance (ZY) chart shows both, which helps when a matching network has series and shunt parts.
A blank Smith chart with no points marked is useful for working problems by hand. You can print a printable Smith chart or save a Smith chart PDF from this page.
Examples made with this generator
Frequently asked questions
What is the difference between an impedance and an admittance Smith chart?
An impedance chart plots normalised impedance z. An admittance chart is the same set of circles turned through 180°. A ZY chart shows both on one sheet.
Can I print a blank Smith chart?
Yes. Press Print and choose your paper size, then print at 100% or “Actual size” with “Fit to page” turned off.
Why does my printed chart look slightly smaller?
Your print dialog may be set to “Fit to page” or “Shrink to fit,” which shrinks the whole sheet. Turn that off and print at actual size.
How many pages can I put in one PDF?
You can set the number of pages from 1 to 50. Every page in the PDF is identical.
Do I need to sign up or install anything?
No. The tool is free, runs in your web browser, and needs no sign-up or download. Your settings are not uploaded.
Does the page remember my settings?
It remembers the paper size you chose last time in your browser. To keep every setting, use Copy link, which stores all current settings.
Can I print a Smith chart on A3 or Tabloid?
Yes. Choose A3 or Tabloid as the paper size and the chart is drawn larger, which makes the fine density easier to read.
Related paper templates
- Ternary diagram: use it to plot three-part mixtures on a triangular grid.
- Polar graph paper: use it for plotting angles and radii, such as antenna patterns.
- Log graph paper: use it when your data spans several orders of magnitude.
- Engineering paper: use it for calculations and drawings that need a grid.
- Millimeter graph paper: use it for precise plotting at small scales.
- Graph paper generator: use it to make standard square or dot grids in many sizes.