Polar Coordinate Graph Paper
Polar graph paper with concentric circles and angle lines, labelled in degrees or in multiples of π.
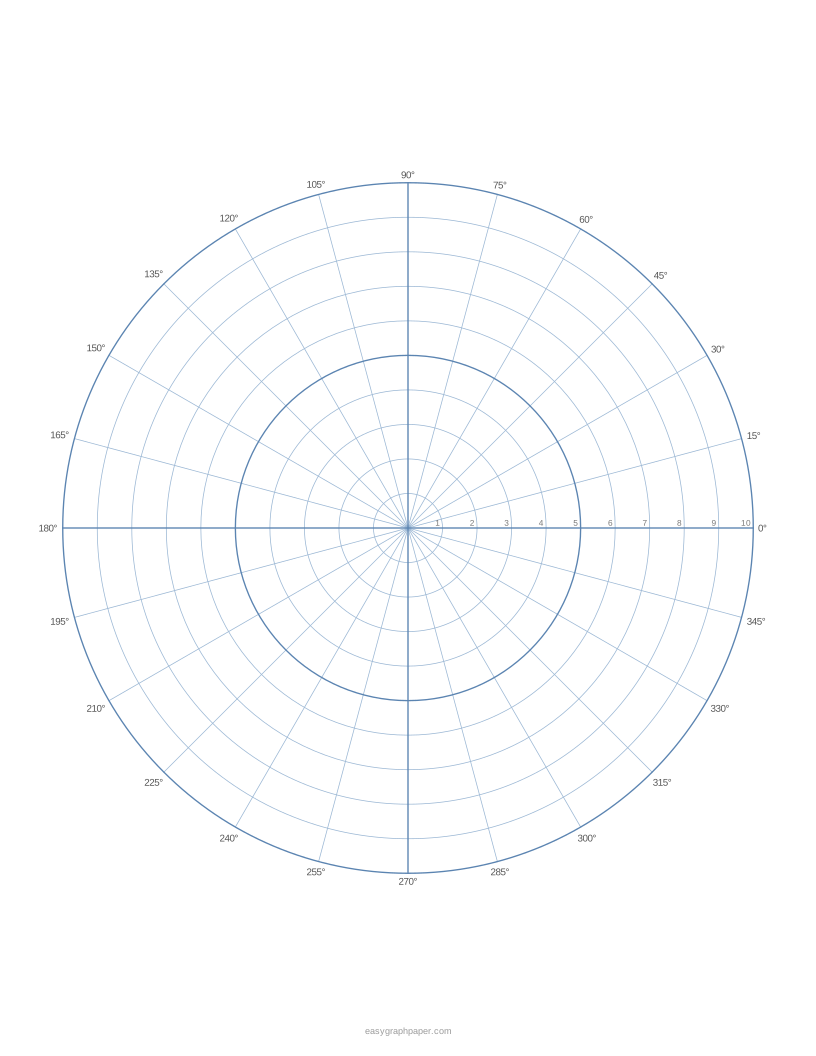
This free polar graph paper generator makes printable sheets of polar coordinate paper, with concentric circles around a centre point and straight angle lines drawn from that centre. It runs in your web browser, and it needs no sign-up or download. You choose the number of circles, the angle spacing and the paper size, then print the sheet or save it as a PDF or SVG.
Polar grids suit problems where a point is easier to describe by its distance and direction than by its x and y position. Common examples include sketching rose curves and spirals, plotting bearings, and drawing circular designs.
How to use the polar graph paper generator
- Pick a paper size (US Letter, A4, US Legal, Tabloid, A3 or A5) and portrait or landscape.
- Set the number of circles, from 2 to 40. The default is 10.
- Choose the angle lines: every 5°, 10°, 15°, 30° or 45°.
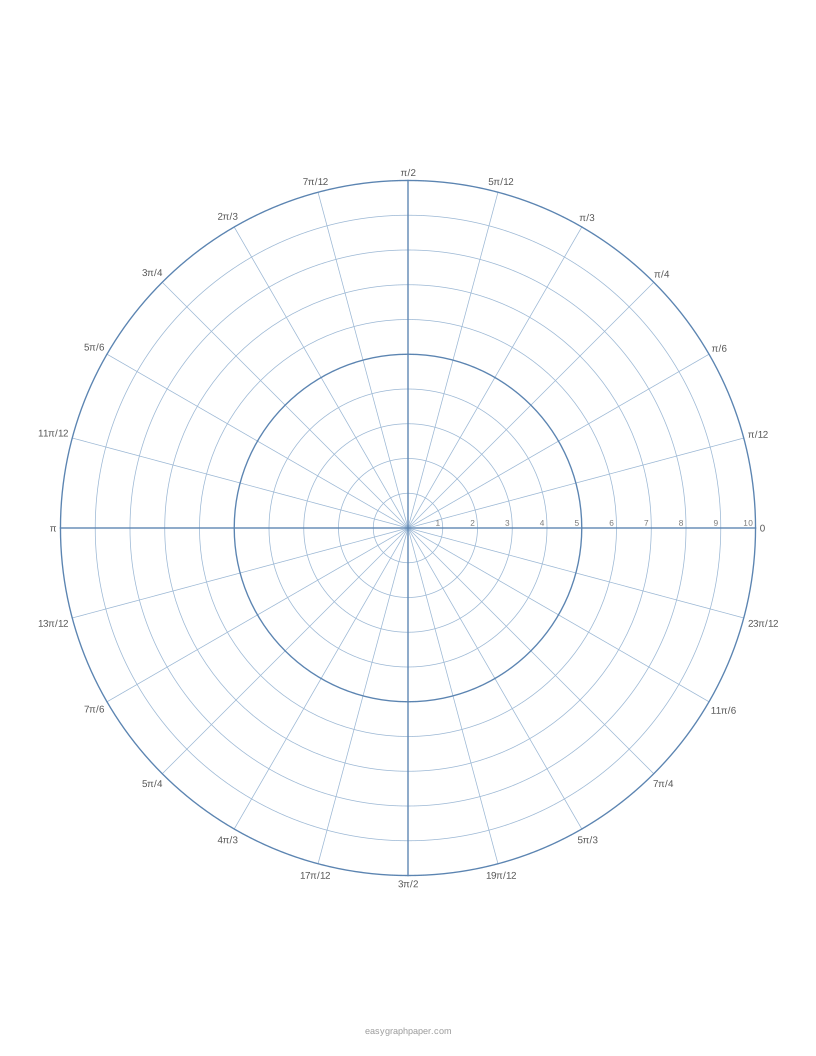
- Choose angle labels in degrees or in radians. Radian labels appear as multiples of π, such as π/6.
- Choose how many light circles sit between the main circles (1, 2, 4 or 5). Turn labels on or off, and turn numbered circles on if you want them.
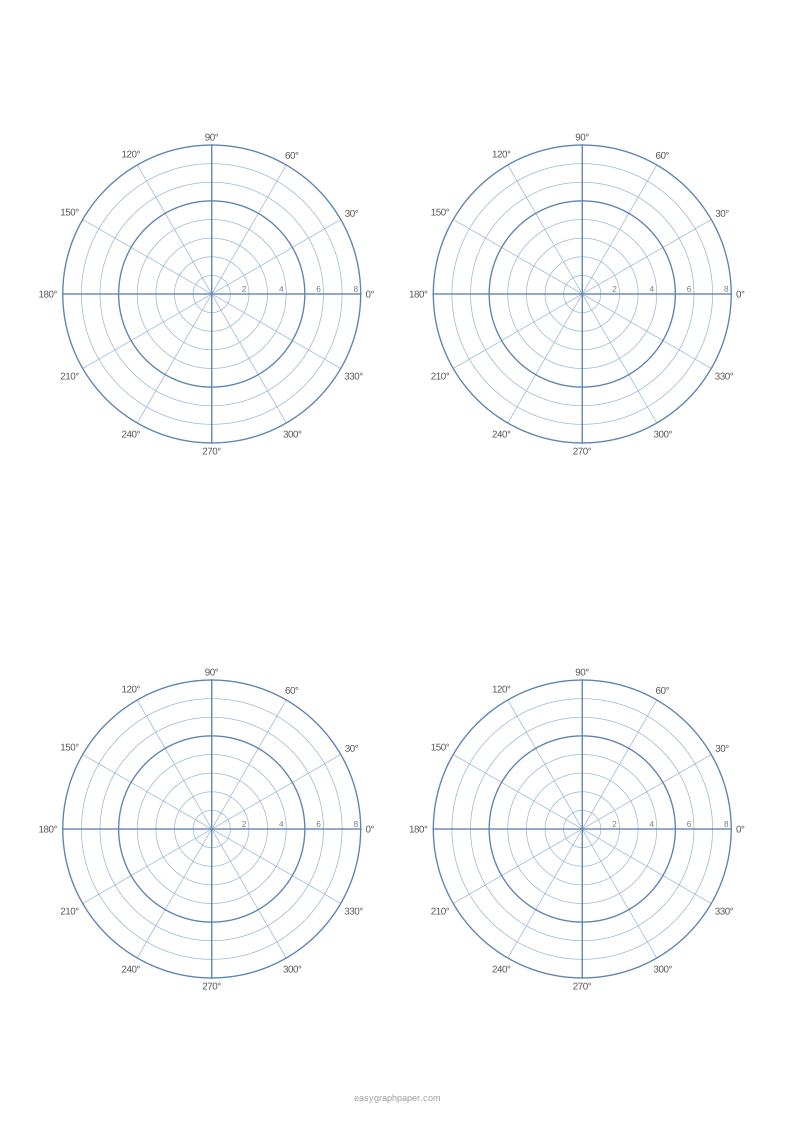
- Choose 1, 2 or 4 charts per page.
- Pick a line colour and line weight. Under “Page and print settings” you can set the margin, add an optional title and a Name and Date line, choose the number of pages in the PDF (1 to 50), or switch off the small site address in the bottom margin.
- Check the preview, then press Print, Download PDF, SVG or Copy link.
Print at 100 % or “Actual size” and turn off “Fit to page” or “Shrink to fit” in the print dialog so the circles keep the spacing shown under the preview. Copy link stores all current settings, so you can recreate or share the same sheet later. The page also remembers the paper size you chose last time.
What is a polar graph?
A polar graph is a grid where each point is located by its distance from a fixed centre point and its angle from a fixed line. The centre point is called the pole, and the line pointing right, at 0°, is the polar axis. A point is written as (r, θ), where r is the distance from the pole and θ is the angle, measured counter-clockwise.
Polar graph paper is the printed form of this grid. Concentric circles mark steps of r, and straight lines through the centre mark steps of θ. Angles can be given in degrees or radians. A full turn is 360°, which equals 2π radians, so 15° is π/12, 30° is π/6, 45° is π/4 and 90° is π/2.
To move between polar and standard coordinates, use x = r·cos θ and y = r·sin θ. To go back, use r = √(x² + y²). These formulas let you check a point on the grid against a normal x-y plot.
How to graph polar curves
A polar curve is drawn by working out r for several angles and plotting each point. Take the cardioid r = 1 + cos θ as an example.
- Make a table of θ values at the angle lines on your sheet, such as 0°, 90°, 180° and 270°.
- Calculate r for each angle. At 0°, r = 2. At 90°, r = 1. At 180°, r = 0. At 270°, r = 1.
- Decide how much one unit of r is worth. If each circle stands for one unit, r = 2 falls on the second circle out from the pole.
- Plot each point on its angle line, at distance r from the pole. A point with r = 0 sits exactly on the pole.
- Join the points with a smooth curve. Add more angles, such as 30° or 45°, for a more accurate shape.
Other familiar polar curves include circles r = a, cardioids r = a(1 + cos θ), rose curves r = cos(kθ) and spirals r = aθ.
How to plot a point on polar graph paper
To plot (3, 60°), start at the pole, turn to the 60° angle line (two lines past 30° on a 15° grid would be 45° and 60°), and count out to the third circle. For a negative r, such as (−2, 30°), go 2 circles out in the opposite direction, along the 210° line.
Examples made with this generator
Frequently asked questions
What is polar graph paper used for?
It is used for graphing polar equations in precalculus and calculus, and for working with vectors and complex numbers. It also suits bearings and navigation sketches, antenna and microphone pick-up patterns, and circular designs and mandalas.
Is radian polar graph paper available?
Yes. Set the angle labels to radians, and the labels show multiples of π, such as π/6 and π/4. The angle lines themselves are spaced at the value you choose: 5°, 10°, 15°, 30° or 45°.
How far apart are the circles?
It depends on the settings. On US Letter with 10 mm margins, the default 10 circles are 9.14 mm apart. With 20 circles and 5° lines, they are 4.57 mm apart.
Is the PDF sharp enough for printing?
Yes. The PDF is vector, not a picture, so the circles and labels stay crisp, and its page is exactly the paper size you chose.
Do I need to sign up or install anything?
No. The generator is free and needs no sign-up or download. The sheet is drawn in your web browser, and your settings are not uploaded.
Which way do the angles go?
Angle 0 is on the right, along the polar axis, and angles increase counter-clockwise, which is the usual convention in maths. 90° (π/2) is straight up.
Related paper templates
- Coordinate plane: use it when you plot points by x and y rather than by distance and angle.
- Graph paper generator: use it for square grids of any size for general graphing.
- Log graph paper: use it when your data spans several orders of magnitude and needs logarithmic axes.
- Smith chart: use it for working with impedance and reflection in radio-frequency engineering.
- Engineering paper: use it for technical sketches and drawings that need a fine, standard grid.
- Millimeter graph paper: use it for precise drawings where each square should be exactly one millimetre.