Log Graph Paper (Semilog and Log-Log)
Semi-log or log-log paper with the number of cycles you need, ready to print or save as a PDF.
How to use the log graph paper tool
- Choose the type: semi-log (one logarithmic axis, the vertical one) or log-log (both axes logarithmic).
- Set the vertical axis to between 1 and 6 cycles. Each cycle covers a factor of 10, so 3 cycles run from 1 to 1,000.
- For log-log paper only, set the horizontal axis to between 1 and 6 cycles.
- Turn labels on or off. When they are on, each cycle’s lines are labelled 1 to 9, and the decade lines are labelled 1, 10, 100 and so on.
- Turn on the extra fine lines at 1.5, 2.5 and so on if you need finer reading.
- Select a paper size (US Letter, A4, US Legal, Tabloid, A3 or A5) and portrait or landscape; landscape gives longer cycles across the page.
- Pick a line colour (light blue, grey, black, green, red, purple, or a custom colour) and a line weight (fine, normal or bold).
- Under Page and print settings, set the margin, an optional title, an optional Name and Date line, the number of identical pages (1 to 50), and whether the small site address in the bottom margin is shown.
- Check the preview, then use Print, Download PDF, SVG or Copy link.
Print at 100 % or “Actual size” and turn off “Fit to page” or “Shrink to fit” so the cycles keep the length shown under the preview. Copy link stores all current settings, so you can recreate or share the same sheet. Your browser also remembers the paper size you chose last time.
What is semi log graph paper?
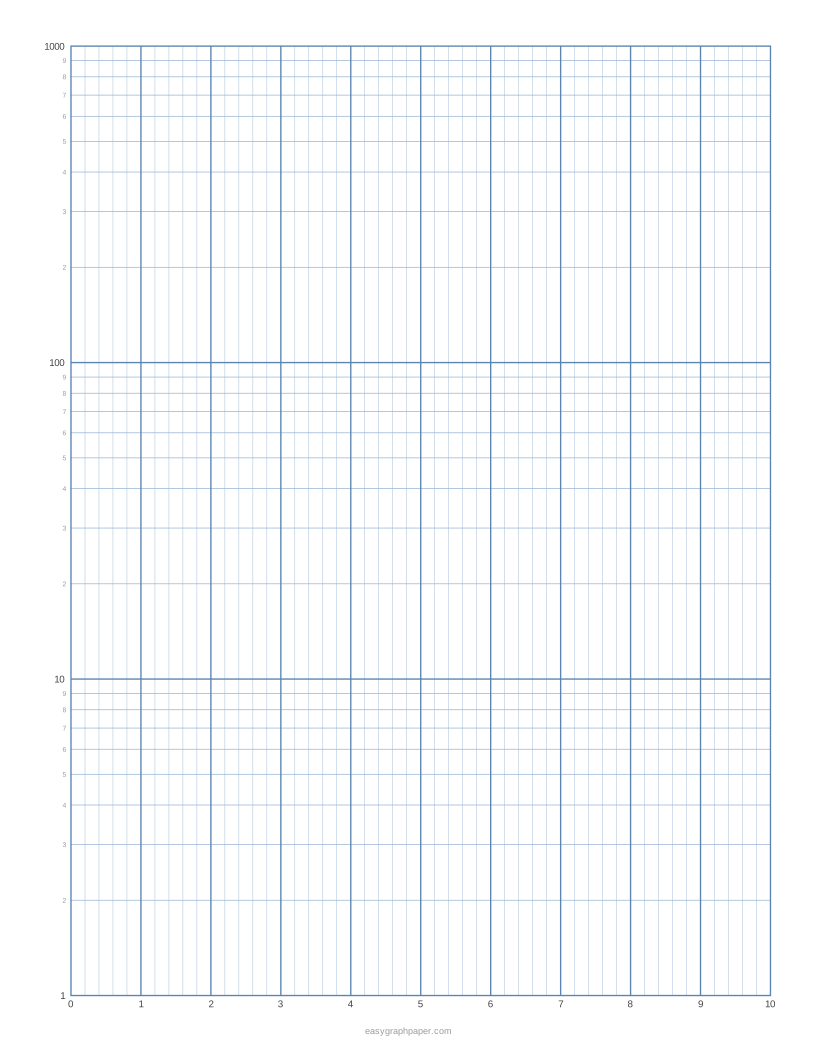
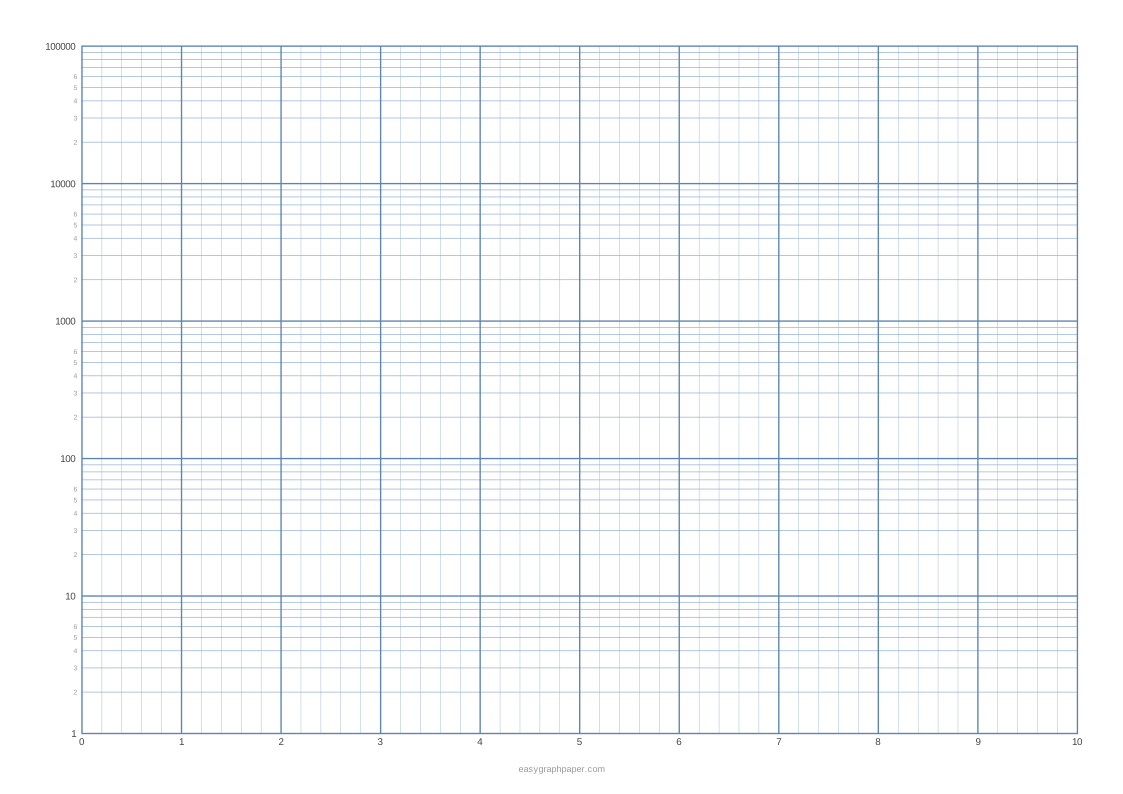
Semi-log graph paper has one logarithmic axis, normally the vertical one, and one linear axis, normally the horizontal one. It fits data where one variable changes by a constant ratio rather than a constant amount. The linear axis is divided into 10 major divisions, each with 5 minor divisions.
On a log axis, equal distances stand for equal ratios, not equal differences. Each cycle, also called a decade, spans a factor of 10, for example 1 to 10, 10 to 100, or 100 to 1,000. A log axis has no zero and no negative values, because zero and negative numbers have no logarithm.
An exponential relationship, y = a·bˣ, plots as a straight line on semi-log paper. Log-log paper has both axes logarithmic instead. There, a power law, y = a·xᵏ, plots as a straight line whose slope is k, so log-log paper is the choice for power laws.
How to read log graph paper
To read a point, first find the cycle it falls in, then its position within that cycle. Within each cycle, the lines for 2 to 9 are unevenly spaced and get closer together as they rise. The line for k sits at log10(k) of the cycle height. So the line for 2 is at 30.1%, the line for 3 at 47.7%, and the line for 5 at 69.9%.
This means a value of 50 sits at the same height in the cycle 10 to 100 as a value of 5 does in the cycle 1 to 10. Labels make this easier to check. The decade lines 1, 10 and 100 mark the cycle boundaries, and the labels 1 to 9 show the lines inside each cycle.
When you read the grid, count cycles rather than squares. The gap from 1 to 10 and the gap from 10 to 100 look the same on the page, because each one is a factor of 10.
Examples made with this generator
Frequently asked questions
What is log log graph paper?
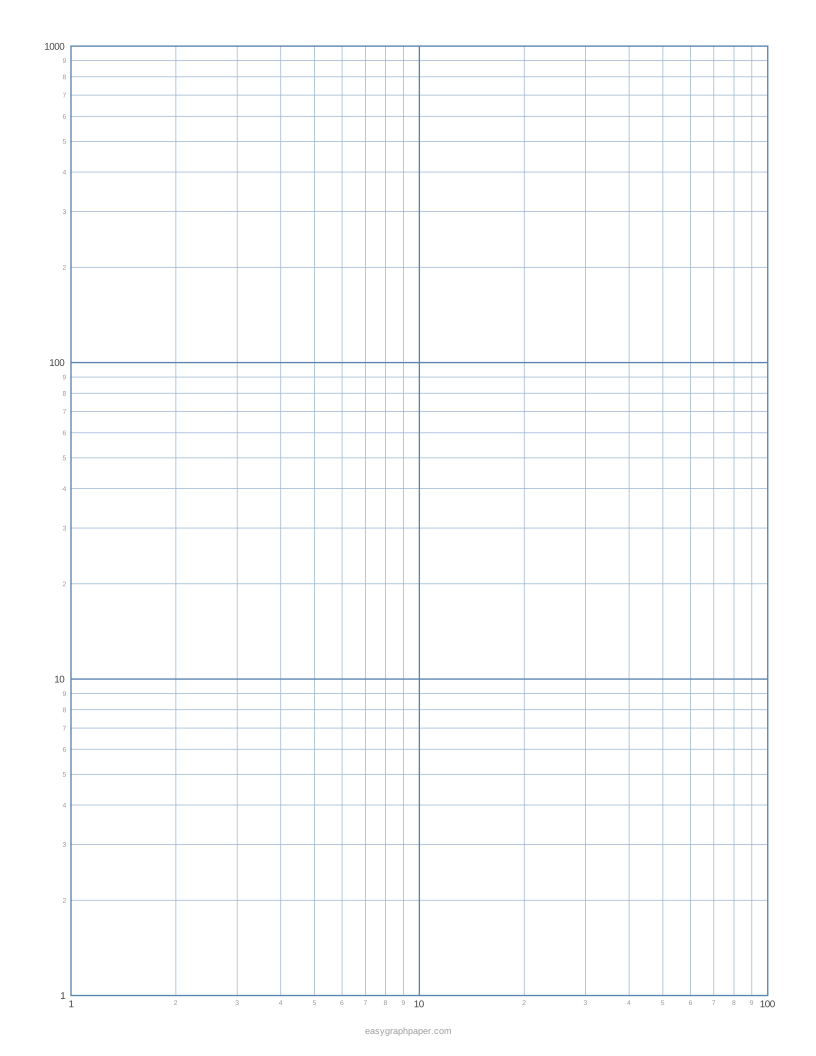
Log-log graph paper has logarithmic scales on both the horizontal and the vertical axis. It is used for power laws, y = a·xᵏ, which plot as straight lines whose slope equals k. To make it here, select the log-log type and set 1 to 6 cycles for each axis.
What is logarithmic graph paper?
Logarithmic graph paper is the general name for any grid paper with at least one logarithmic axis. Semi-log and log-log are the two forms, and this page creates both.
How do you make a log graph?
Choose enough cycles to cover your data, and relabel the decade lines to suit it, so the first 1 can stand for 1, 10 or 0.1. Plot each point by placing its x value on the linear axis and its y value at its position within the right cycle, then draw the line. With US Letter paper and 10 mm margins, a 3-cycle semi-log sheet gives 83.73 mm per cycle.
How to plot semi log graph paper?
First pick enough cycles for your data. For example, data from 3 to 4,000 needs 4 cycles: 1 to 10, 10 to 100, 100 to 1,000 and 1,000 to 10,000. Then plot the linear variable on the horizontal axis and the logarithmic variable on the vertical axis, and join the points with a line or curve.
Can a log graph show zero or negative values?
No. A log axis has no zero and no negative values, so every value you plot must be positive. If your data includes zero or negative numbers, use a linear axis instead.
Related paper templates
- Graph paper generator - use it for square grids when your data does not need a logarithmic scale.
- Millimeter graph paper - use it for plotting linear measurements on a fine metric grid.
- Engineering paper - use it for engineering layouts and drawings that need a standard grid.
- Polar graph paper - use it for plotting angles and distances from a central point.
- Smith chart - use it for plotting radio-frequency impedance.
- Coordinate plane - use it for plotting linear x and y values on labelled axes.