T Chart Template
A printable two-column graphic organizer: type the headings or leave them blank, then print or save a PDF.
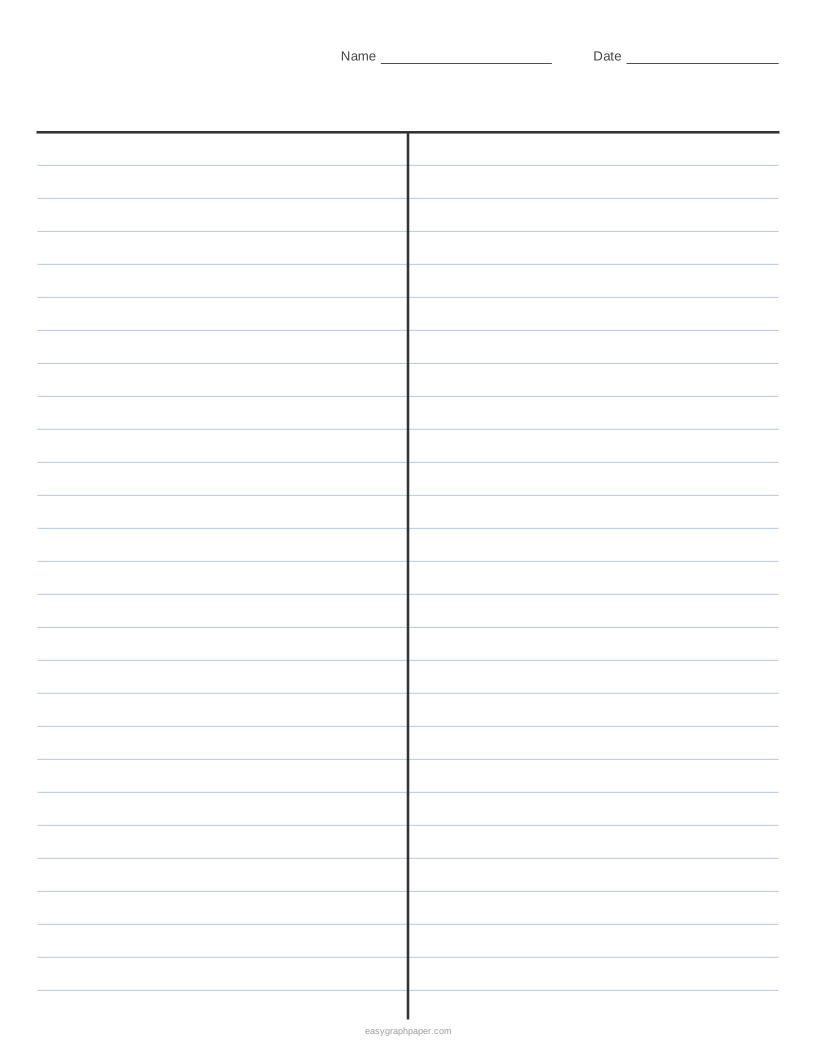
The T chart template on this page is a free tool that makes printable T charts in your web browser. You choose the headings, columns, and paper size, then print the sheet or download it as a PDF. No sign-up or download is needed.
A T chart splits a page into two columns so you can compare two things side by side. You can start from a blank T chart or pick a preset such as Pros / Cons, Facts / Opinions, or Before / After. The page also offers 3-column charts, two charts per page, and an optional Name and Date line.
How to use the T chart template
- Choose a paper size: US Letter, A4, US Legal, Tabloid, A3, or A5, in portrait or landscape.
- Pick a preset (Blank T chart, Pros / Cons, Facts / Opinions, Before / After, 3 columns, or 2 per page), or set your own options.
- Type the left and right headings, such as “Cause” and “Effect”. Leave them empty if you want to write the headings by hand.
- For three columns, select 3 columns and type a middle heading.
- Turn the ruled lines on or off, and set the line spacing. Wide rule (11/32 in) is the default.
- Choose a line colour and line weight (fine, normal, or bold).
- Under Page and print settings, set the margin, add an optional title, switch the Name and Date line on or off, and choose how many identical pages go in the PDF (1 to 50).
- Check the preview, then click Print, Download PDF, SVG, or Copy link.
When you print, choose 100 % or “Actual size” and turn off “Fit to page” or “Shrink to fit” so the line spacing stays as set. Copy link stores all current settings, so you can recreate or share the same sheet later. The page also remembers the paper size you chose last time.
What is a T chart?
A T chart is a graphic organizer made of a heading line and a vertical line down the middle. The two lines form a capital T and split the page into two columns for comparing two things.
Each column gets a heading, and points are written across from each other so the two sides can be compared directly. Common uses include pros and cons, facts and opinions, cause and effect, before and after, problem and solution, compare and contrast, and sorting examples into two groups in class.
What is a T chart graphic organizer?
A graphic organizer is a visual sheet that shows how pieces of information relate to each other. A T chart is one of the simplest kinds, because it has only two sections to fill.
The heading line tells the reader what each side means, and the vertical line keeps the two sides separate. This layout makes it easy to see which points match, which side has more support, and where information is missing. Because the structure is so simple, you can use it for almost any two-sided topic.
Example of a T chart
Should our class get a pet fish?
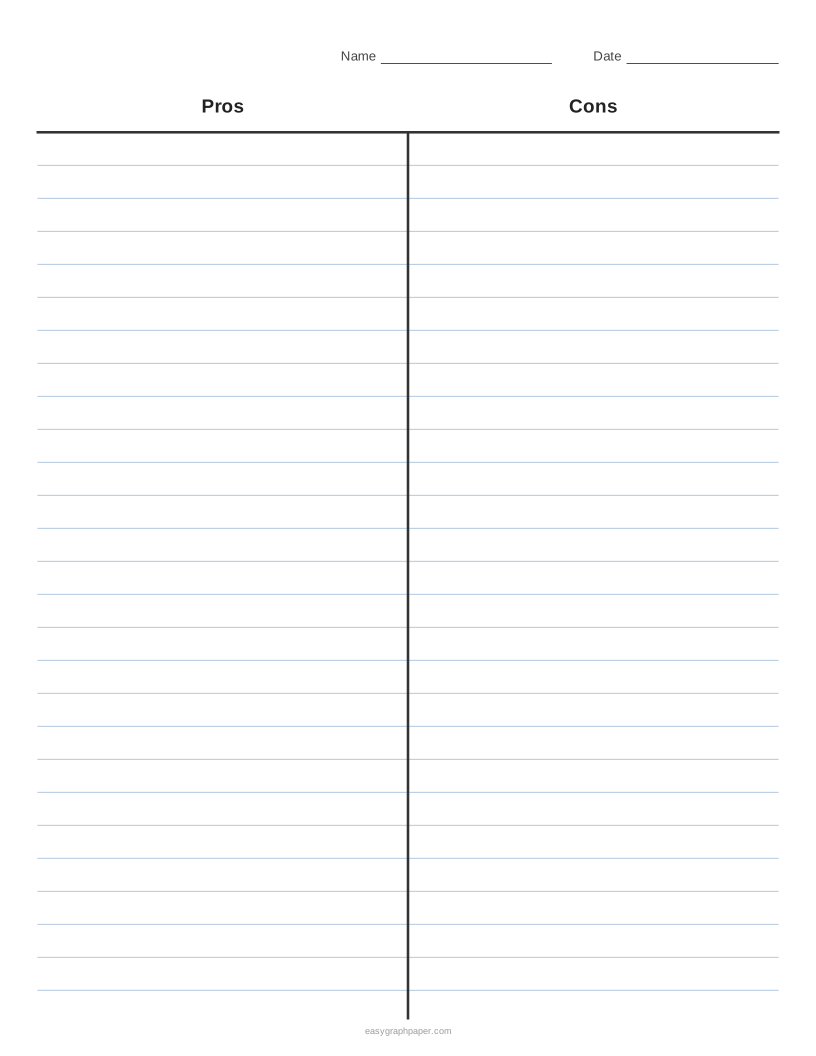
| Pros | Cons |
|---|---|
| Teaches responsibility | Needs feeding at weekends |
| Calm to watch | The tank must be cleaned |
| Low cost | Fish can get sick |
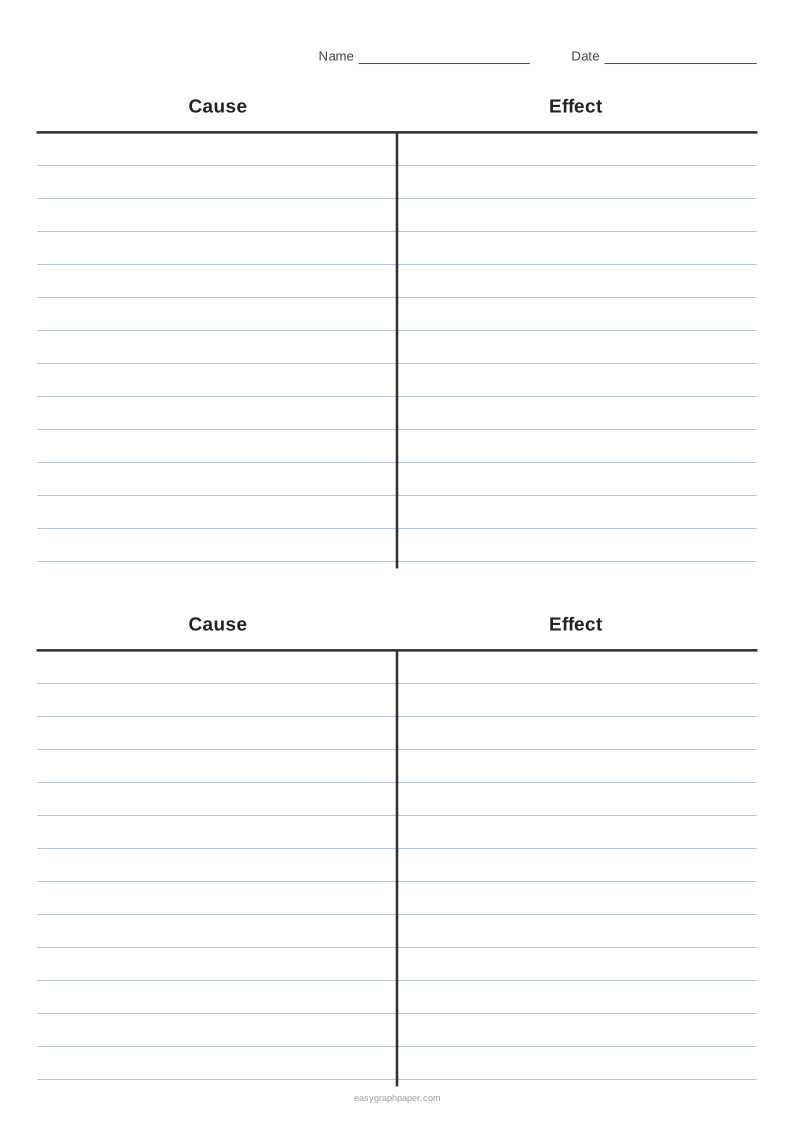
A cause-and-effect T chart works the same way: “It rained all night” in the Cause column sits opposite “The football match was moved indoors” in the Effect column. In a facts-and-opinions chart, “The Moon orbits the Earth” is a fact and “The Moon is the most beautiful sight in the sky” is an opinion.
How to use a T chart in class
Write the topic as the title, label the two columns, then fill one side at a time or alternate between them. Put matching points on the same line so the comparison is easy to read. When the chart is full, count the points on each side, circle the strongest ones, and use them to write a conclusion or plan a paragraph.
Examples made with this generator
Frequently asked questions
How do you make a T-chart?
Draw a horizontal line near the top of the page. Then draw a vertical line from its middle down to the bottom, write a heading on each side, and list points opposite each other. This page can also make the chart for you, so you do not have to draw it.
How do I create a T-chart in Google Docs?
This page does not create Google Docs files. It makes a printable PDF of the chart. Set your headings and options, then click Download PDF and print the file or keep it for later.
Can I print a blank T chart?
Yes. Choose the Blank T chart preset, leave the headings empty if you want to write them by hand, and print at 100% or “Actual size.”
How many lines are on a T chart?
The default chart on US Letter has 26 ruled lines under the headings. If you choose two charts per page, each chart has 12 lines.
Can I make a three-column chart?
Yes. Choose 3 columns and type a middle heading as well as the left and right ones. A three-column chart works for “Know / Want to know / Learned” or for comparing three options.
Related paper templates
- Cornell notes template: Use it when you take notes from a lecture or reading and want a space for questions and summaries.
- Lined paper: Use it for general writing practice or when you need plain ruled lines.
- Grid paper: Use it for drawing diagrams, graphs, or maths work that needs squares.
- Habit tracker: Use it to record daily or weekly habits and check your progress.
- Number line: Use it to show counting, ordering, or positive and negative numbers.
- Dot grid paper: Use it for sketches, bullet journalling, or layouts that need light guidance.