3D Graph Paper
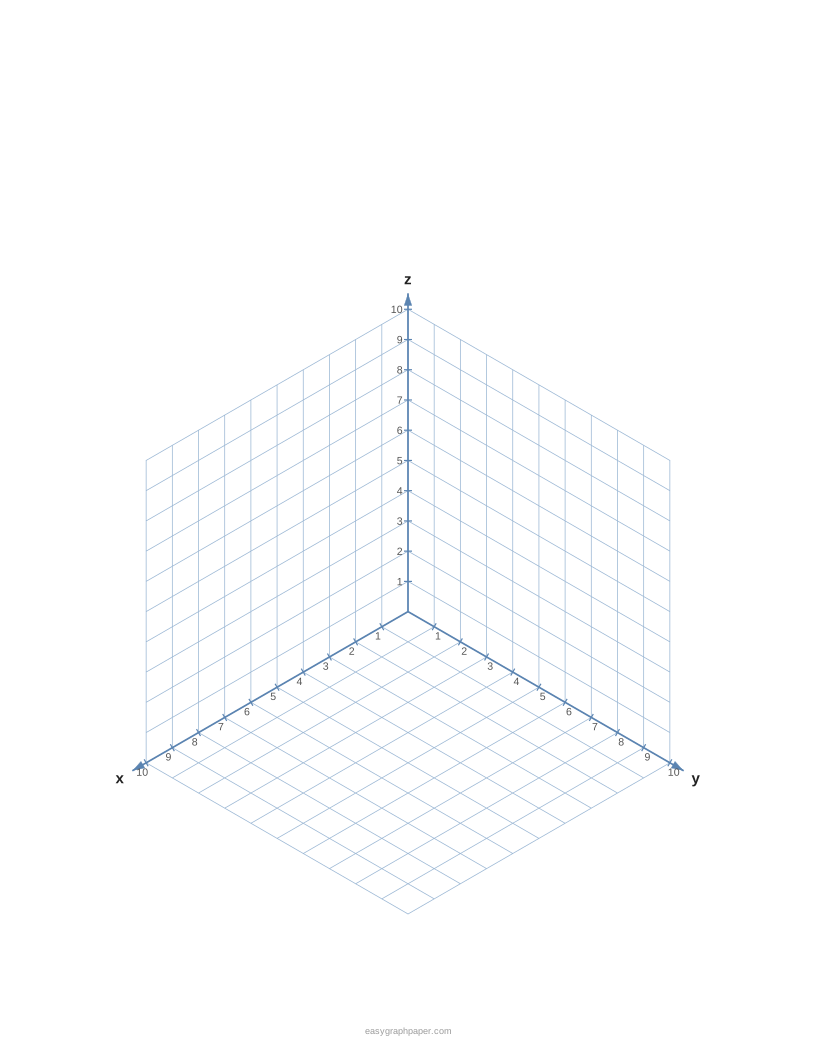
Print x, y and z coordinate axes for plotting points in three dimensions.
How to use the 3D graph paper generator
- Choose the projection: isometric or oblique (cabinet).
- Set the units per axis, from 2 to 20. The default is 10, so each axis is numbered from 0 to 10.
- Pick the unit length. The default is 8 mm. You can also choose 5 mm, 1/4 in, 1 cm, 1/2 in, 15 mm or a custom length.
- Choose how the negative axes appear: dashed or first octant only.
- Pick the background. Isometric view offers isometric dots or isometric lines. Oblique view offers a square grid.
- Turn on the grid on the three coordinate planes of the first octant (the xy floor and the xz and yz walls), if you want it.
- Set the tick marks and numbers to every 1, 2 or 5 units. Turn arrowheads and the x, y and z labels on or off.
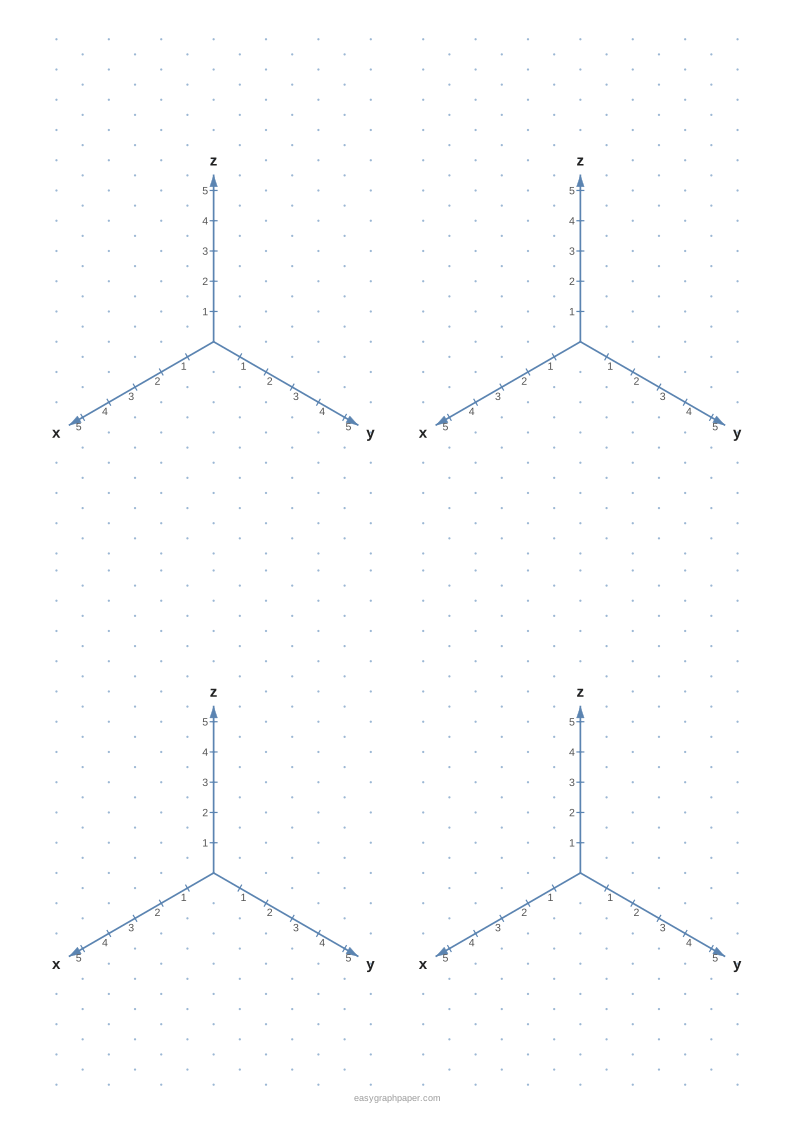
- Choose how many sets of axes go on each page: 1, 2 or 4.
- Pick the paper size (US Letter, A4, US Legal, Tabloid, A3 or A5) and the orientation. Check the preview.
- Press Print, Download PDF, SVG or Copy link.
Print at 100% or “Actual size,” not “Fit to page,” so the lengths match the unit length you set. Copy link saves all your current settings, so you can return to the same sheet later.
How to plot points in 3D
To plot a point (x, y, z), start at the origin and move x units along the x direction. Then move y units parallel to the y axis, and finally move z units straight up, parallel to the z axis. Mark the spot where you stop.
For example, to plot (3, 2, 4), move 3 units along x, then 2 units parallel to y, then 4 units up. Drawing the dashed path that forms a box corner makes the point easier to read. Points with all three coordinates positive sit in the first octant, which is what the default sheet shows.
What is the difference between isometric and oblique projection?
Both projections show three axes on a flat sheet, but they draw them differently. In isometric projection, the three axes are 120° apart, z points up, x runs toward the lower left and y toward the lower right. Every unit is the same length on all three axes, so the drawing looks balanced.
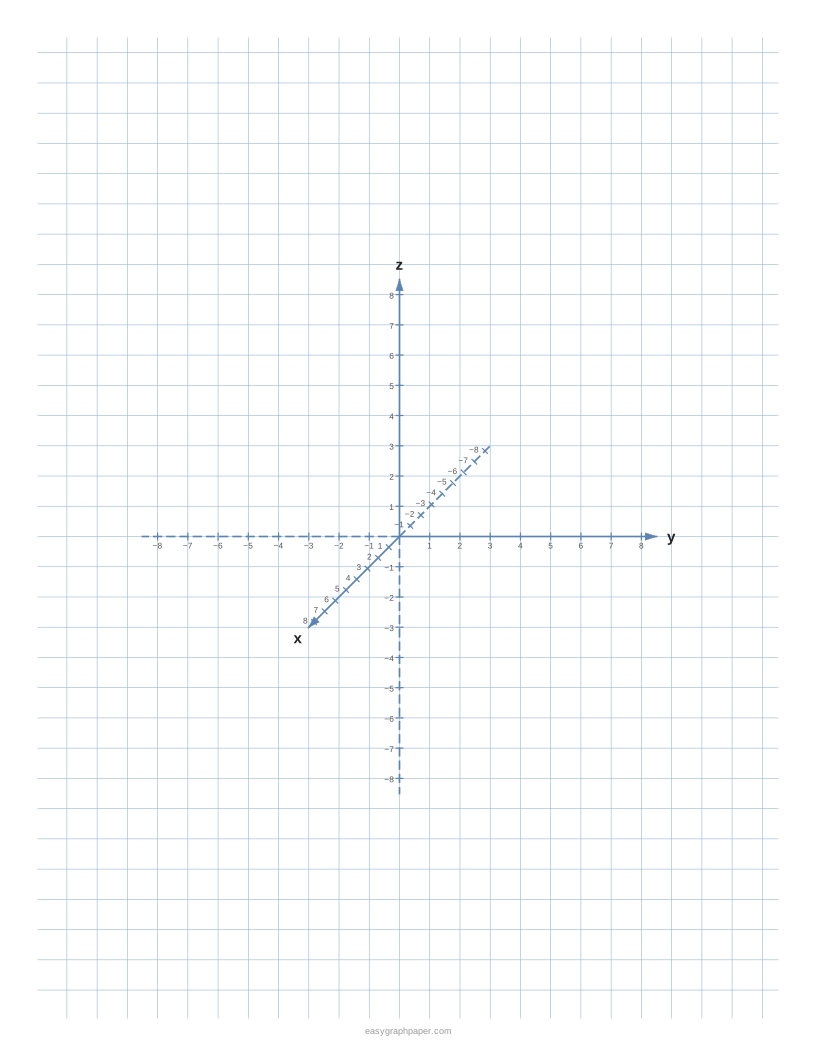
In oblique (cabinet) projection, y runs to the right and z points up. The x axis is drawn at 45° toward the viewer, and each x unit is drawn at half length (a scale factor of 0.5). Oblique is simpler to measure along the depth direction, while isometric treats all three axes equally.
Can I print negative axes?
Yes. Under the negative axes setting, you can show the negative parts of the axes as dashed lines, or show only the first octant. The first octant is where x, y and z are all positive, so it is the usual choice for basic plotting.
Turn on the negative axes when you need to work with all eight octants, such as points with negative coordinates. Dashed lines mark the negative directions, so they are easy to tell apart from the positive ones.
Examples made with this generator
Frequently asked questions
Is isometric dot paper the same as 3D graph paper?
No. 3D graph paper has coordinate axes for plotting (x, y, z) points. Isometric dot or line paper is a background pattern for drawing 3D shapes. You can get that background from the background option here or from the isometric graph paper page.
Can I print more than one copy on a single PDF?
Yes. Under page settings, you can set the number of identical pages in the PDF, from 1 to 50.
Can I add my name, a title or a date to the page?
Yes. Under page and print settings, you can add an optional title and a Name and Date line. You can also change the margin, which defaults to 10 mm, and switch off the small site address in the bottom margin.
How big is one unit on US Letter?
The default setting (isometric, 0 to 10, grids on the three planes) uses 8 mm per unit on US Letter. Four sets per page with a range of 5 also fit at 8 mm per unit.
Is the 3D graph paper free to print?
Yes. The generator is free, needs no sign-up or download, and draws the sheet in your browser, so nothing is uploaded. Print as many copies as you need for a class.
Related tools
- Isometric graph paper — use it when you want a flat isometric grid for sketching 3D shapes rather than plotting coordinates.
- Coordinate plane — use it for plotting points in two dimensions with x and y axes.
- Graph paper generator — use it to make standard square grid paper for everyday graphing.
- Dot grid paper — use it for sketching and note-taking on a light dot pattern.
- Polar graph paper — use it when your points are described by distance and angle.
- Perspective grid — use it for drawings with vanishing points, such as scenes with depth.